


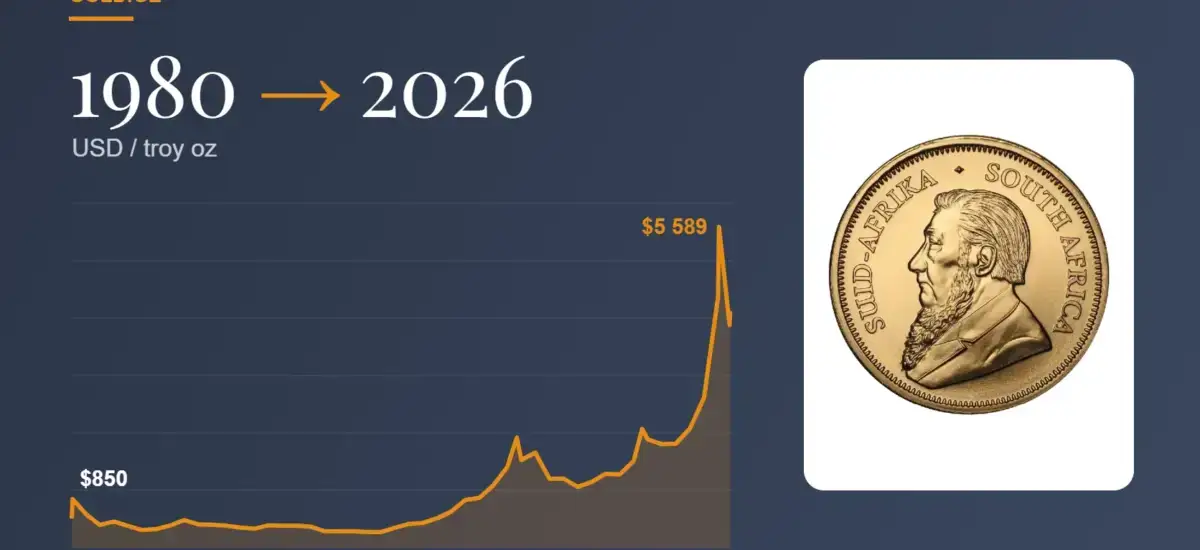
“Is gold expensive right now, or cheap?” It’s the question we hear most at the counter. One day’s price can’t answer it, but a gold price chart covering 46 years puts things in perspective. Below is the chart from 1980 to today, and what it actually shows.
The first thing the chart tells you is that gold doesn’t always go up. There’s a twenty-year slide, a ten-year boom, a few quiet years and a very steep climb at the end. Here’s each stretch in turn.
011980–2001: a peak, then twenty years of waiting
On 21 January 1980 an ounce of gold cost $850, the result of a decade of high inflation and two oil shocks. By the end of that same year it was down to about $590.
Then came the long, dull years. Inflation cooled, interest rates stayed high and investors preferred stocks. Gold bottomed out on 20 July 1999 at $252.80 an ounce. Anyone who bought at the 1980 peak only got back to their price, in nominal terms, in 2008.
The lesson still holds: gold is a long-term asset, but gold bought at the wrong moment can take years to pay off.
022001–2011: gold’s best decade
At the end of 2001 an ounce cost $276.50. Ten years later, in September 2011, it reached roughly $1,920, close to seven times more.
It wasn’t a straight line. During the 2008 financial crisis gold fell to $712.50 on 24 October, as investors sold anything they could to cover losses. Within months the rally was back on. We covered that period in more detail in Gold During a Crisis.
032012–2015: when gold got cheaper
2013 was a rough year: gold lost 27%. The economy was recovering and money flowed back into stocks. By the end of 2015 an ounce was $1,060, almost 45% below the 2011 high.
That dip is easy to spot on the chart, and it’s why we’re upfront about it: gold is not something that only goes up.
042019–2026: the record years
From 2019 gold started climbing again. In August 2020, during the pandemic, it broke $2,000 an ounce for the first time. 2024 closed at $2,609 and 2025 at $4,368.
The all-time high came on 28 January 2026: $5,589. Then the price turned. On 30 October an ounce was around $3,880, 31% below the record. Our October review explains what happened.
On the morning of 9 November an ounce on Gold.ge costs $4,122.58, or 10,830 lari. One gram of 999.9 gold is 348.19 lari.
05The decades at a glance
| Year-end | Ounce, $ | What was going on |
|---|---|---|
| 1980 | 590 | just after the inflation peak |
| 1990 | 386 | long stagnation |
| 2000 | 274 | end of the twenty-year slide |
| 2010 | 1,406 | post-crisis rally |
| 2015 | 1,060 | after the 2013 drop |
| 2020 | 1,888 | pandemic |
| 2025 | 4,368 | record year |
LBMA Gold Price PM on the last trading day of each year, rounded.
06How to read the chart properly
First, it’s in dollars and not adjusted for inflation. $850 in 1980 is worth far more in today’s money, so the old peaks look lower on the chart than they really were.
Second, the lari price moves differently. Gold is priced in dollars worldwide, so when the lari weakens, gold gets more expensive in lari even if the dollar price hasn’t moved. Today’s gold price in lari and dollars is on our price page and updates about every 10 seconds.
Third, the chart shows the market price, not the price of a bar. A bar or coin carries a premium on top, and it’s bigger on small weights. At our store today it’s about 20% on a 1 g bar and about 4% on a 1 oz bar.
This article is for information only and is not investment advice. Past performance doesn’t promise the same in future.
→ What drives the gold price · Gold during a crisis · Gold bars
07What people ask us most
When was gold at its highest price?
The all-time high was set on 28 January 2026: $5,589 per troy ounce.
Is gold expensive or cheap right now?
On 9 November an ounce is around $4,123. That’s below January’s record but well above the end of 2024 ($2,609). Nobody knows the “right” price, which is why many people buy gold in stages.
Has gold ever fallen for a long time?
Yes. After the 1980 peak the price slid for almost 20 years, and between 2011 and 2015 it lost about 45%. Gold works best over the long run.
Why is the lari price different from the chart?
The chart is in dollars. The lari price also depends on the exchange rate: when the lari weakens, gold gets more expensive in lari.
Where can I see today’s price?
On the Gold.ge gold price page, in lari and dollars. It updates about every 10 seconds, and paying online locks the price at that moment.
Gold at today’s price
Bars and coins online or in our stores: Galleria Tbilisi (2/4 Shota Rustaveli Ave) and Radisson Blu Iveria. Pay online and the price locks the moment you pay; Keepz has no commission.
Gold barsGold coinsGold price today